What is OutOfMemory exception? How to identify them? How to avoid?
What is OutOfMemory?
OutOfMemoryException will be thrown when there is not enough chuck of memory for the program to allocate. The problem can be tricky sometimes as the stack traces are not always pointing to the right places (where memory leaks occur), due to the location of the exception thrown could be anywhere the program tries to allocate memory while there is not enough.
The causes of this type of exception can be summarised as below:
-
The software itself it is very memory consuming. In this case, we cannot do much from the software side but to upgrade the hardware to have enough RAM.
-
There is potential memory leaks in the software. The symptom is usually that as we start up the program, the performance of the software will decrease overtime as we usually refer to “the software is slow”. If restarting the software the performance will come back and then again decrease overtime.
-
Low memory performance (excessively requesting memory). This could be the underlying programming algorithms are not developed to be memory efficient. The performance will usually get worse when dealing with the large amount of data.
To identify the causes of OutOfMemory exception, here are two things we can do:
-
Memory profiling and take snapshots - There is a few memory profiling tools in the market such as dotMemory, Ants Memory Profiler or .Net Memory Profiler which could assist locating memory issues. By observing the memory usage graph and comparing the memory snapshots, we will be able to tell which type of objects are increasing overtime, then we need to think the question “Does our system need such many objects?”
-
Collecting stacktraces – even though the stack traces sometimes are not directly related to the real problem. But by collecting many of them could be helpful to identifying the potential locations which are aggressively allocating memory.
Symptoms and Analysis:
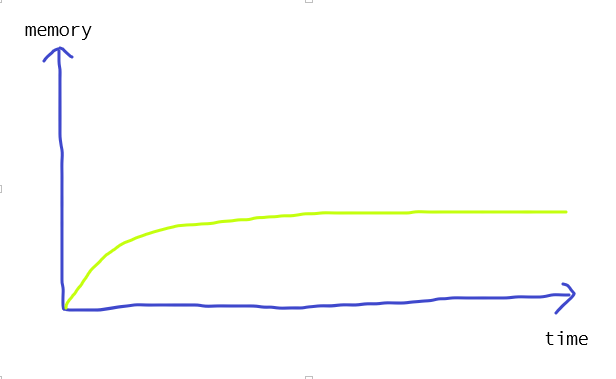
- If the memory of the software is properly managed, the memory will grow as the software starts up in the beginning. It may have some small fluctuations, but then the overall memory usage will remain stable at around a certain value. It may go up or down if user performs some operations but the memory won’t continue increasing overtime.

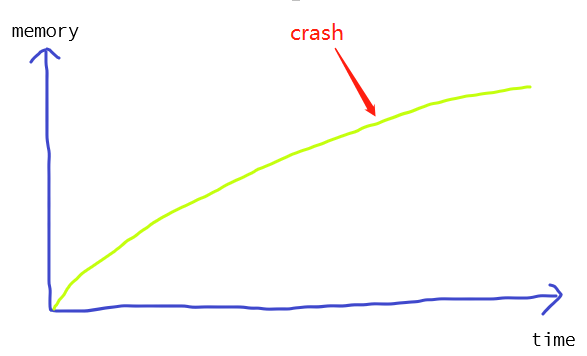
- If the memory keeps increasing, it is very likely there are memory leaks in the system. Eventually it will crash at a certain point. As a programmer, be aware of the background threads doing update or remove operations. The unmanaged objects to be updated or removed must be disposed/released explicitly in code. Otherwise they will remain in the memory util the software process is killed or stopped.

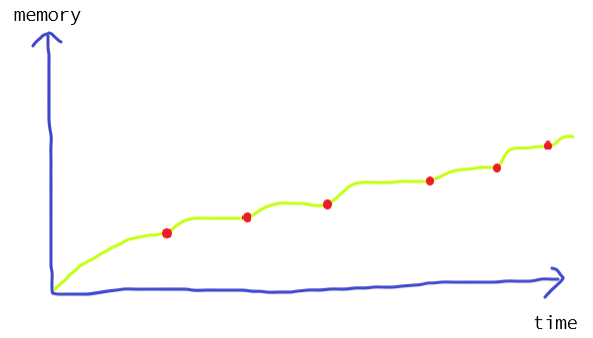
- Here is another leaking scenario which requires user’s operations. For example, it a user open a window and close it multiple times. Every time the window is closed the resource should be released. If not, the memory graph will look like below. Each red point indicates the user clicking on the open/show window button. In this case, to locate the problem would not be too hard. Review the code that closes the window and release the data once not using.

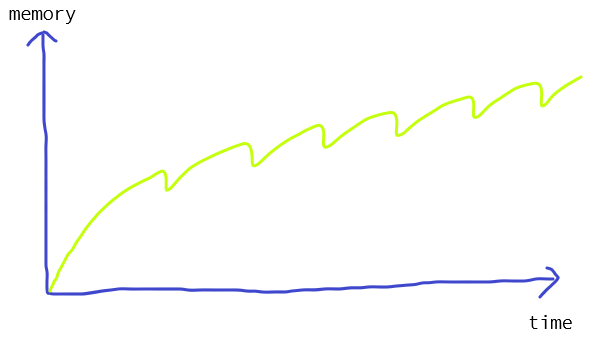
- In this graph below, the memory graph starts spiking at a certain point. This is likely to be the memory consuming algorithms running and keep requesting large chucks of memory. The drops indicate that the Garbage collector can sense memory pressure and comes in to free up some memory. But the collecting speed cannot catch up the memory allocating speed. In the end, the software will crash with the out of memory exception. In this scenario, the exception stacktraces should indicate the areas where the memory consuming code is running. Optimise the algorithms and avoid inefficient database queries.

Reference: OutOfMemoryException in C#.